Spanish
Go to Part I
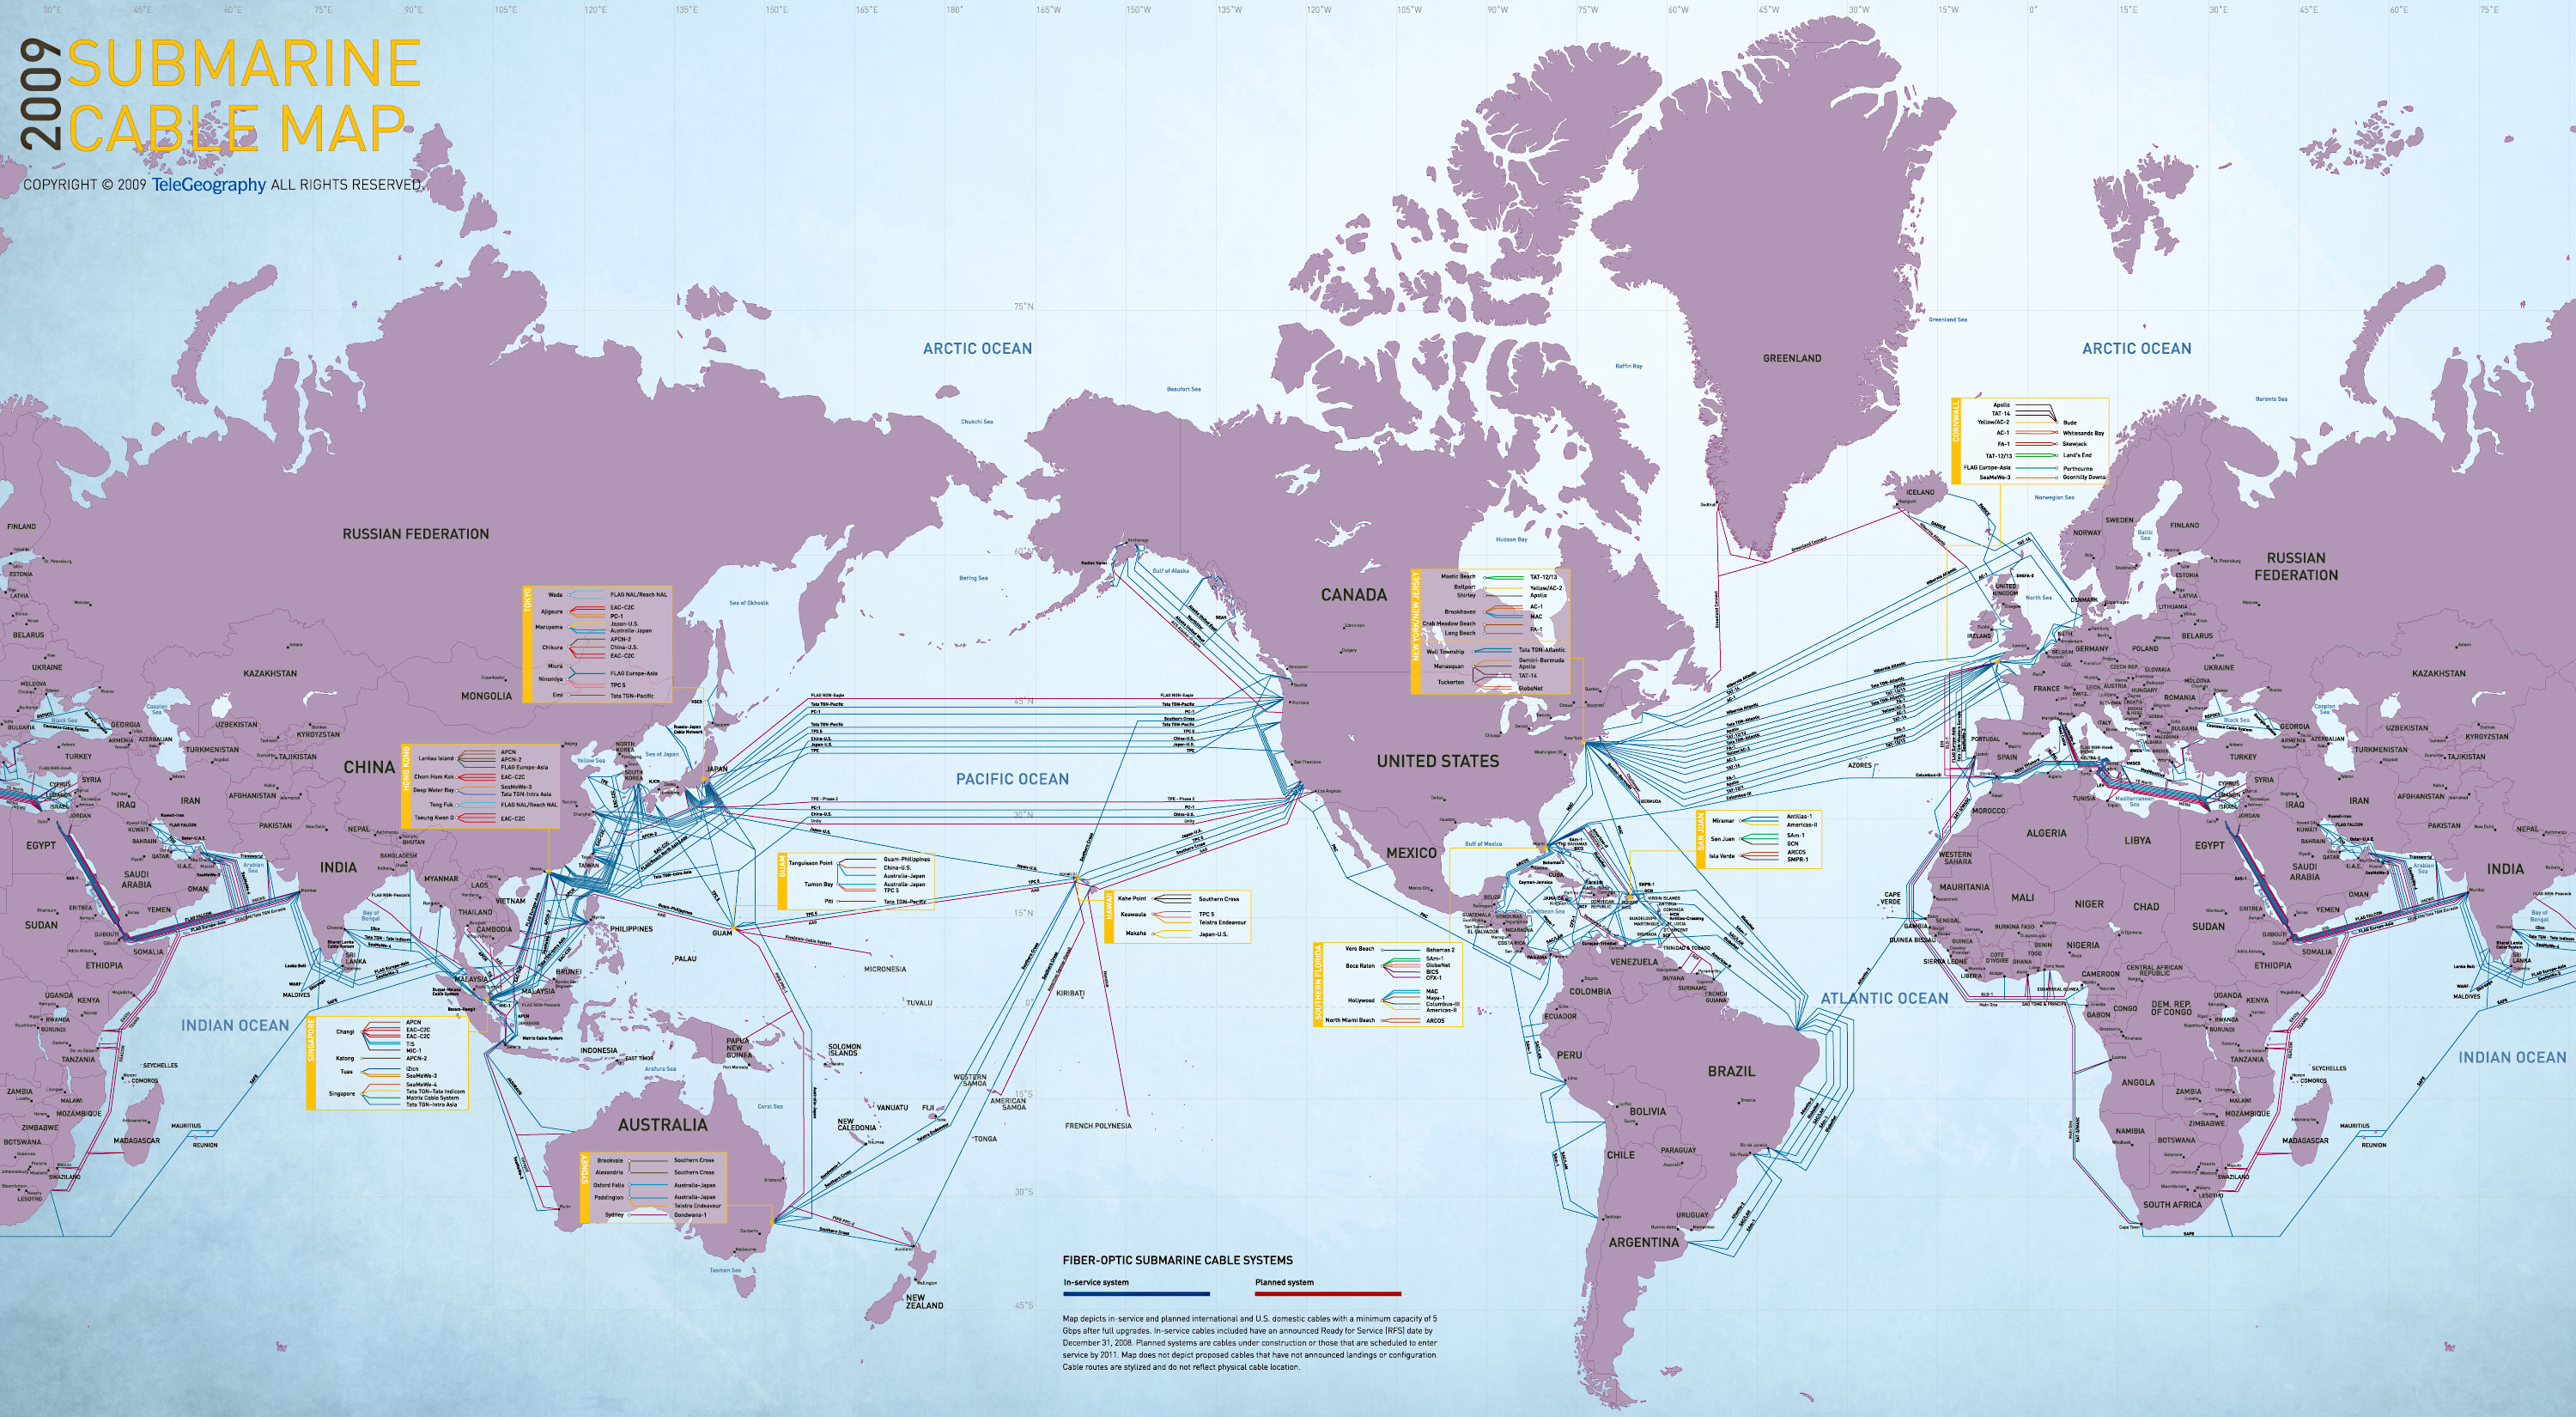
As we have already mentioned, another main issue related to the material infrastructure of the digital deals with the submarine cables, which involve several political, social and economical factors.
In 2010, Wikileaks disclosed a list of "critical infrastructure" around the world, a list of «secret» places that, if damaged or disrupted, would seriously compromise the security of the US. The report included the undersea cables, which nowadays1 support over the 95 per cent of transoceanic Internet traffic [19]. According to Nicole Starosielski, one of the consequences of this report - and of its labelling by the US government as tantamount to giving terrorist a target list - was that several mainstream media and independent bloggers tried to show how the information about the location of these submarine cables was widely accessible, pointing to numerous websites where this information was visible, such as the satellite views on Google Earth [20].
:
 Submarine Cable Map


The submarine cable as "material" infrastructure
.
Indeed, nowadays, it’s easy to have access to well documented maps of the infrastructure conformed by the Internet submarine cables [21]. However, some artists have used this material as an starting point to make visible not only the submarine cables themselves, but also the historical, social, political and environmental issues that surround their installation. As an example, we could mention the website Surfacing, created in 2013 by a team of artists and researchers directed by Starosielski herself.
According to her,
"Surfacing is a digital mapping project that aims to convey the significance of cable systems to a broad audience beyond the cable industry. The project combines the exploration of digital stories with a game-like structure (…) The premise of the project is that users begin at a single point in the cable network, from which they are able to dive into a set of stories (past and present) about cable systems. From this location, they are challenged to navigate their way to a specific end point in the cable network" [22].
To allow the navigation, the project is organized in six different layers: Image, Story, Theme, Map and Node. Each of them explores different levels of the cultural history of the cables in different locations, composing a rhizomatic and global view of the material aspects of this kind of infrastructure and the consequences they have, for instance, for the population of a single place [23].
.
 Surfacing. Screenshot showing one of the layers
.
Environmental Issues
Going back to Casemajor’s reflections, another political issue that has gained growing attention in digital media studies - and also in the related art practices - concerns the degradation of the natural environment in the so-called "Anthropocene" [24]. After mentioning several scholars that, as Jussi Parikka, have highlighted the connection between these environmental issues and the political economy of digital media, Casemajor points out that the main issues involved in this approach "range from pollution of rivers and farmlands due to ICT-related industries, energy consumption and CO2 production in server farms, green computing, built-in obsolescence in digital material culture, e-waste and the management of electronic media remains" [25].
Of course, all these issues can be found as critical subjects in the work of several artists. For instance, in 2014, the Spanish media artist Joana Moll created the website CO2GLE, focused precisely on the subject of CO2 emissions. The project is a real-time, net-based installation that displays, approximately, the amount of CO2 emitted each second due to the global visits to google.com. According to the artist, the 40% of the Internet’s total carbon footprint may be attributed to websites design, while the Internet is responsible for the 2% of CO2 of global emissions - more than the aviation industry. Therefore, CO2GLE tries to make these facts visible and, by symbolically linking our actions with their material impact on the physical world, intends to trigger thoughts and actions able to stimulate our consciousness, thus generating a critical approach about the true nature of technology [26].
.


Fragments of Jamie Allen's infographics. The entire project can be explored here.
.
Other artists have also made huge efforts to make visually apprehensible the phenomenon of energetic consume. We could mention, for instance, Jamie Allen’s infographics, in which he displays the power required by big data centers, and compares them with the global use of energy, revealing, among other data, that Google uses the 0,7% of the same.
The hardware obsolescence and the frantic consumerism of technology has led to the problem of the so called "e-waste" accumulation. Some artists, such as Chris Jordan, have approached this issue by using waste, and particularly e-waste, to create large scale pictures of technological devices. Although his strategy could seem quite obvious, it is aimed not only to find a new creative use for this remains, but also to foster a reflection about the problem itself [27].
:
 Chris Jordan, Cell phones #2, Atlanta 2005 , 44 x 90"
.
On a less literal approach, in 2014 the US media artist Julia Christensen created the project Burnouts. The project started from a visit made by the artist to an e-waste recycling center in southern India, which at the moment of her arrival had just received 200 tons of e-waste, imported mostly from the US. Floored by the vision, she begun ta research on how to fill the gap between that mountain of e-waste and the personal narratives of the users: how do people deal with the electronic devices that they use and then throw away? Burnouts is a series of five sculptural video projectors, constructed with discarded iphones. They have been modified to project on the ceiling images of ‘retired constellations’, that is, constellations no longer considered as useful to study the stars. In many cases, this ‘retirement’ is due to the fact that the light on the planet has increased so much that they are no longer visible. Thus, by striking up a dialogue between the obsolete technologies and the constellations that become obsolete because of technologies, Christensen creates a poetic metaphor of the e-waste, which - just as the constellation - is still there, but no longer in use [28].
Media Artist Julia Christensen Turns Old iPhones Into Art
.
Data Quantification
The large volume of data generated through digital communications and information processing - the so called Big Data - has also opened up the possibility of "mining" that information to visualize the infrastructure of the digital itself, as well as to analyze its political and financial concerns.
Although we have already seen how data could be used to disclose environmental issues linked to the material infrastructure of the digital, as in the project CO2GLE, we will now approach this issue from a different perspective. For instance, the project The Internet in Real Time by the collective Pennystocks is a website that shows, precisely, the real-time growth of the Internet, which is, the amount of data shared, accounts created or purchases made trough the main Internet services, as google, youtube, Facebook or Amazon. The website gives also the option to "watch how these Internet giants accumulate wealth in real-time". And its then, where the data are translated into actual money, when we are able to grasp the material side of the digital infrastructure of these Websites.
.

Click the animation to open the full version (via penny stocks).
.
Following this line, but with a rather ironical perspective that tries to question the phenomenon of Big Data itself, the already mentioned artist and researcher Jamie Allen, together with David Gauthier, developed the project Critical Infrastructure as a commission for the Transmediale Afterglow Festival 2014. The project was the result of a three months research and production residency in which the artists worked in a workshop format with local collaborators in Berlin. Through this process, they created a technological sculpture, composed by a thicket of altered and unaltered metrological survey equipment, that occupied the main foyer space of the HKV building, the Festival venue. But what was it about?
:


.
Critical Infrastructure, by Jamie Allen and David Gauthier. Transmediale Afterglow Festival 2014
.
Described as a media-technical landscape/architectural survey, Critical Infrastructure allowed the direct observation and live presentation of metadata for the festival and its surroundings. This means that, thanks to the use of geotechnical instruments and landscape measurement technologies, the materials and systems that allow media arts, media artists, festival and venues to exist and persist, were revealed to the visitors. Thus, they were offered precise perspectives on questionable data, through numerous viewfinders and reference markers placed in the space. Signals and data - from static facts, such as the festival budget, to the building temperature or vibration and online metrics, such as Facebook likes or Youtube video views - were visualized and correlated as graphs and charts, techno-aesthetically highlighting the reserves of materials, energies, signals and data behind everything going on around the visitors. But, particularly, the project created a kind of an over-coded and superfluous additional infrastructure [29].
In an interview given to Daphne Dragona for neural.it, Allen states that:
"The particular measurements selected show different scales or layers of infrastructure that support the Transmediale festival, and this supposedly auspicious notion of “digital culture” more generally. There are straightforward things that come to mind, like the power consumption of parts of the Haus der Kulturen der Welt cultural building, or the number of ‘Likes’ on Transmediale’s Facebook account. Beyond that, we wound up making a kind of parallel point about the amount and accuracy of this type of data. That is, we used data like “The Number of Views of the Most Popular Video on YouTube (Gangnam Style)”, which is, as of this writing 1,913,296,796. Now, that number is both cognitively and likely analytically entirely meaningless. How is it collected? I don’t see the number rise by one when I watch the video one time, so what the hell is happening there? And what could it possibly be feeding into, or used for? Why do “we” create it, maintain it? So some of our infrastructural data was wildly arbitrary, pointing at the ridiculousness of quantification and our general human propensity towards measuring everything, all the time, for its own sake" [30].
Thus, as Daphne Dragona herself puts it:
"Users would be caught by surprise when first encountering the screens of the installation. Why would the level of noise at the HKW café need to be correlated to the numbers of likes of the Facebook Transmediale page? What does the light level of the building have to do with the Bitcoin currency rate? With a purposeful confusion that of course would leave no space for identifying any patterns, the technological sculpture Critical Infrastructure aimed to raise questions about our datafied present and our quantified lives" [31].
Conclusions
Although the infrastructures that support digital communications are usually invisible, they are fundamental and absolutely necessary elements for the existence of the digital itself. Although the intrinsic complexity and materiality of these infrastructures remained out of the focus of digital communication for a long time, in recent years a claim for their analysis, and particularly, for their visualization form critical perspectives able to grasp their complexity and their consequences for individual and social life, has arisen both in scholar and artistic fields. In this sense, bu exploring topics as the visualization of infrastructures themselves, as their environmental issues or data quantification, Media Artists play a key role in opening this black box, as well as in deploying such critical approaches to the infrastructure of the digital, thus fostering the development of what could be described as an "infraestructure aesthetics" that goes hand in hand with our increasing awareness of its importance.
.
Notes
[19] See International Submarine Cable Protection Committee (December, 2008) About Submarine Telecommunications Cables: Report of the International Submarine Cable Protection Committee.
[20] Nicole Starosielki, "Warning: Do Not Dig. Negotiating the Visibility of Critical Infrastructures" in Journal of Visual Culture, London: SAGE Publications, 2012. Vol 11(1): 38–57.
[21] See for instance the resource Submarine Cable Map by Telegeography.
[22] Nicole Starosielki, ‘Surfacing: A Digital Mapping of Submarine Systems’, in Suboptic 2013. From Ocean to Cloud, conference proceedings.
[23] The project can be accessed at here.
[24] The term "Antrhopocene" defines Earth's most recent geologic time period as being human-influenced, or anthropogenic, based on overwhelming global evidence that atmospheric, geologic, hydrologic, biospheric and other earth system processes are now altered by humans. For more information, click here.
[25] Nathalie Casemajor, “Digital Materialisms: Six Frameworks for Digital Media Studies", Westminster Papers in Communication and Culture (WPCC), Special issue on ‘The Internet and the Material Turn’, 10.1 (2015).
[26] Both the project and artist’s statement can be seen here.
[27] More information at artist's Website.
[28] See Julia Christensen’s Website.
[29] See Jamie Allen's Website.
[30] Dragona, Daphne, "Critical Infrastructure – A media-technical landscape survey for Transmediale 14" in Neural Magazine, March 20th 2014.
[31] Idem.